The above figure reveals the geometry of the electrospray ionization-charge reduction process (ESI-CR). The beauty of this ion generation process is that it is extremely easy to set up and it can yield singly charged ions exclusively. Deliberately impacting the highly charged aerosol droplets with the grounded metal surface reduced the charge distribution of the BSA-containing droplets in a manner similar to the desorption electrospray process (DESI). There are other methods of charge reduction. There is even a commercial ESI-CR system made by TSI Inc. that we have in our laboratory. We use the method depicted above because it is extremely robust, reproducible, and expedient.
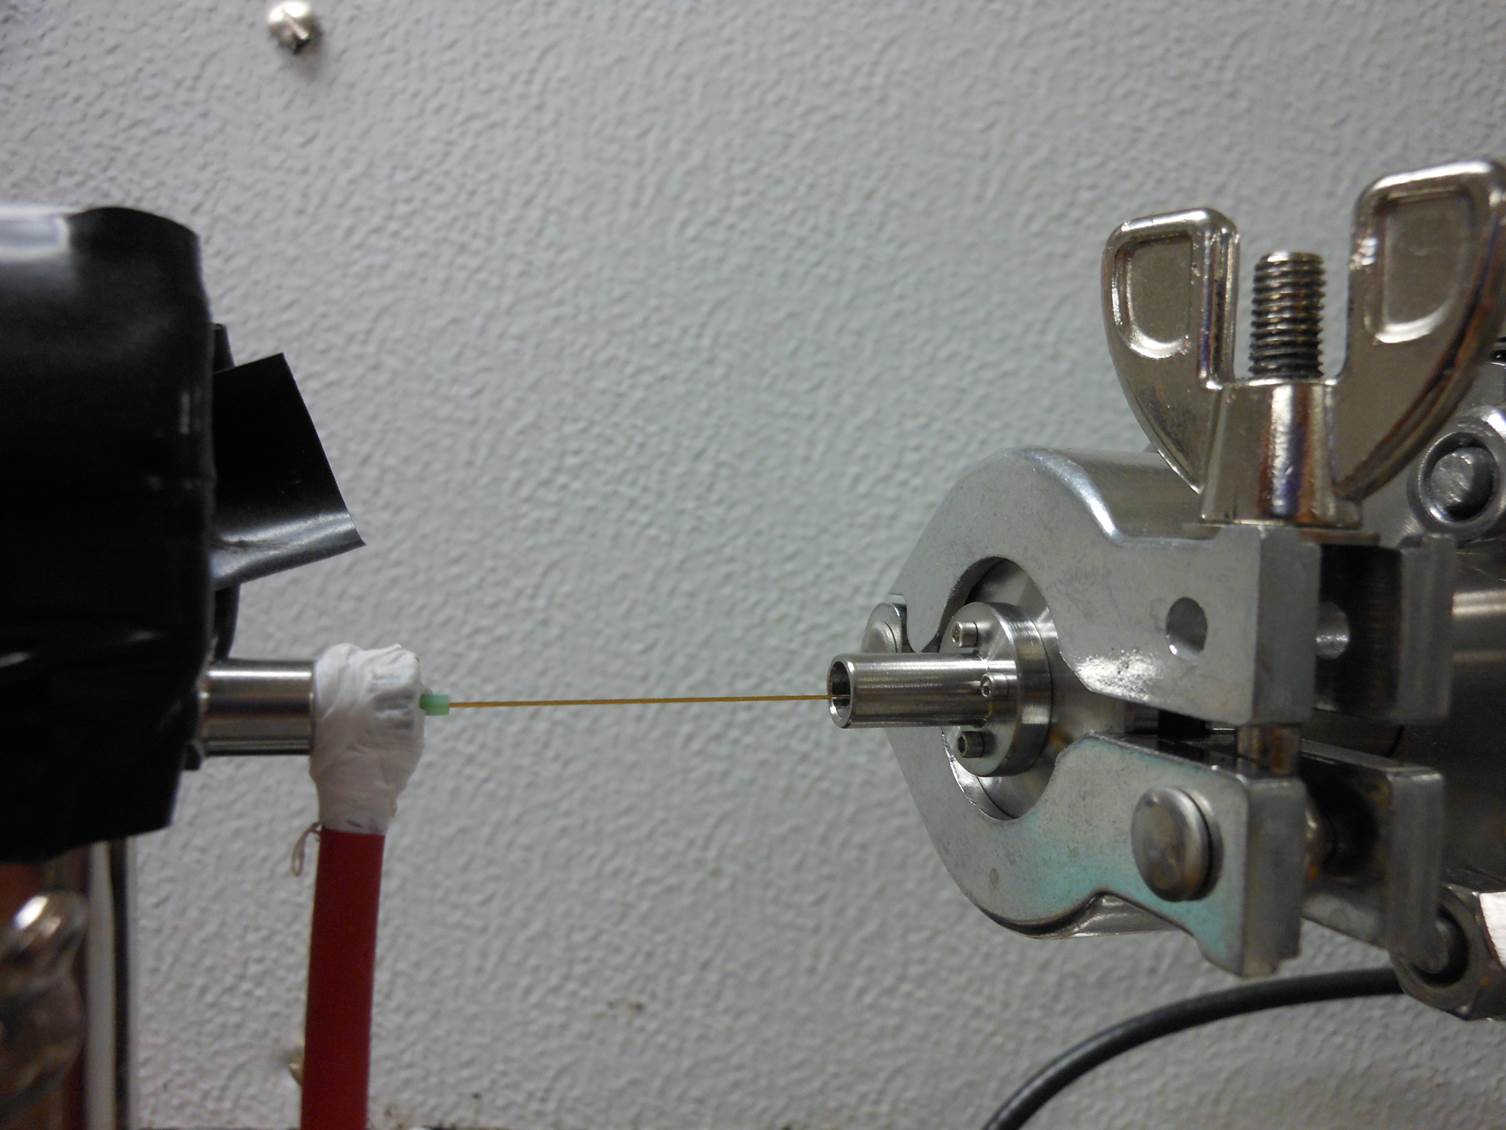
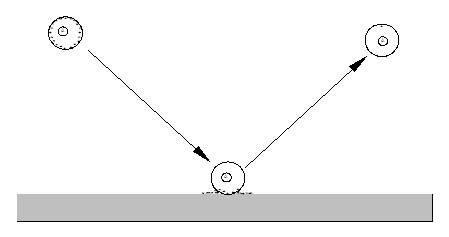
Nanospray is used to produce highly-charged analyte-containing droplets inside a grounded ¼”diameter stainless steel nipple in front of a 100-nm diameter flow limiting orifice. The electrical potential drives the charged droplets into the inside surface of the stainless steel tube. When the droplets hit the surface of the tube, the chemical potential drives the charge from the surface of the droplets onto the tube, and the neutralized droplet careens off of the surface back into the ESI plume.
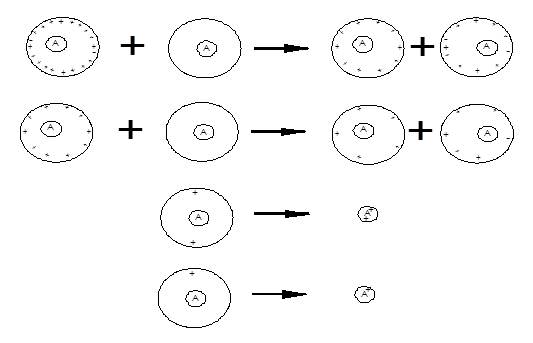
 In the plume, neutralized droplets interact with charged droplets and share charge. The interaction with the surface and each other shifts the charge distribution of the droplets. The chemical potential between the droplets induces charge transfer so that the charge is evenly shared. Multiple collisions distribute the charge. The residual charge left on the droplets is then transferred to the analyte upon solvent evaporation in the vacuum.
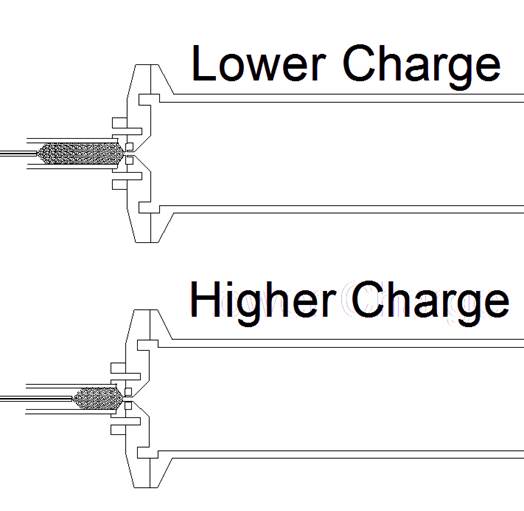
 Adjusting the distance between the capillary tip and the inlet orifice adjusts the droplet charge distribution. Larger distances between the ESI capillary tip yield greater opportunity for the droplet distribution to lose residual surface charge before they enter the inlet where the solvent evaporates leaving the charge on the analyte. Therefore, mounting the ESI on a translation stage permits adjustment of the charge distribution.
What are the implications for quantitative analysis of complex protein distributions?
This method of charge reduction has interesting ramifications for quantitative analysis. The charge reduction process occurs while the hydrophilic analyte is entrained inside the droplet. The charge loss process is then complete independent of the analyte. It only depends on the solvent. Logically, the analyte only begins to interact with the excess charge on the droplet surface as the solvent evaporates in vacuum. If there is only one residual charge on the droplet, the transfer of that charge to the analyte should occur with unit probability (Where else would the charge go?) and be independent of the composition of the analyte. Naturally, this concept will begin to break down with increasing analyte charge; however, when the charge-charge interaction on the analyte is negligible, the probability of charge transfer to the analyte is independent of composition or sequence. Analyte independence of the charging process means quantitative analysis will be much easier because the analyte concentration should be directly proportional to peak area for all analytes as singly-charged ions.
To illustrate our ability to manipulate the ion charge, spectra were observed as a function of the electrospray needle tip translation into the ¼” OD tube. These are single unaveraged spectra. Pulling the tip back yielded singly charged ions only. For this spectrum, the stock solution was diluted by a factor of 20 in 1:1 methanol/water yielding 50 μg/mL total concentration of all the proteins. The next spectrum was from the same stock solution but was diluted by a factor of 100 to yield a total concentration of 10 μg/mL. This spectrum was taken on a different day. To make the ion intensities in the spectra comparable, the mass spectrometer was set to collect the ESI-CR output for 10 times as long. Ideally, if the charge reduction conditions were identical, the ion intensities in second spectrum should be twice that of Figure 4. It is not quite because the charge reduction conditions were changed slightly so that approximately 10% of the ions were doubly charged and the average ion ratio of each protein in the spectrum is 1.920 ± 0.024. That yields a 1.3% standard deviation in the relative signal intensities of all the proteins. Moreover, the doubly charged ion intensities map the singly charged ion intensities. In other words, the ratio of singly to doubly charged myosin is the same as that for carbonic anhydrase or the rest of the proteins. If the charging process were analyte dependent then these ratios would be different.
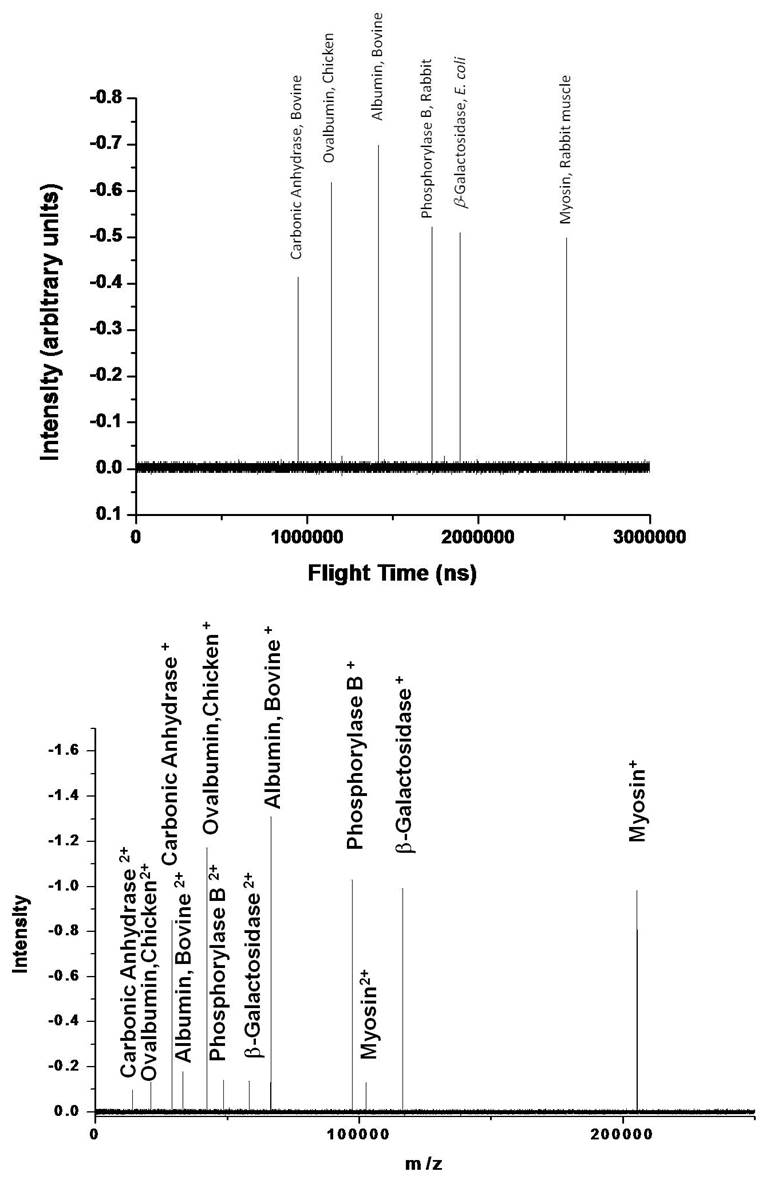
It is also important to take a moment to recognize that the ion intensities are not significantly changing as a function of m/z. Normally the ion intensity drops dramatically with increasing m/z.

The above is a charge reduced mass spectrum from Lloyd Smith’s group (Charge Reduction Electrospray Mass Spectrometry, Anal. Chem. 2000, 72, 52-60) with equimolar amounts of seven nucleotides. Note how the size of the peaks decreases and the peak shape deteriorates with increasing m/z. This spectrum goes up to only 16,000! The comparison of this spectrum with ours reveals the advantages of our ion handling technique in comparison to the state of the art. It also indicates that we should be able to perform quantitative analysis on proteins.